Buddhabrot
The Buddhabrot was discovered by Melinda Green around 1993. It's a method for plotting the Mandelbrot set that produces particularly transcendental images that resemble Hindu art and it has, in fact, convinced at least one person that the Hindus were the ones to get it right according to an old site I found while researching the subject. The images are produced by repeatedly picking random points in the vicinity of the Mandelbrot set and iterating them. If and only if they escape, we increment the brightness of each pixel that the point enters during the iteration process. Then, of course, we renormalize the brightness of the pixels for display.
Getting Started
I have a good deal of experience with the Mandelbrot set so luckily it wasn't too complicated to get a decent test render. This render is of the region of the complex plane from -2-2i to 2+2i. There isn't much nuance to this naive implementation, so I'll just leave that part up to your imagination for now.
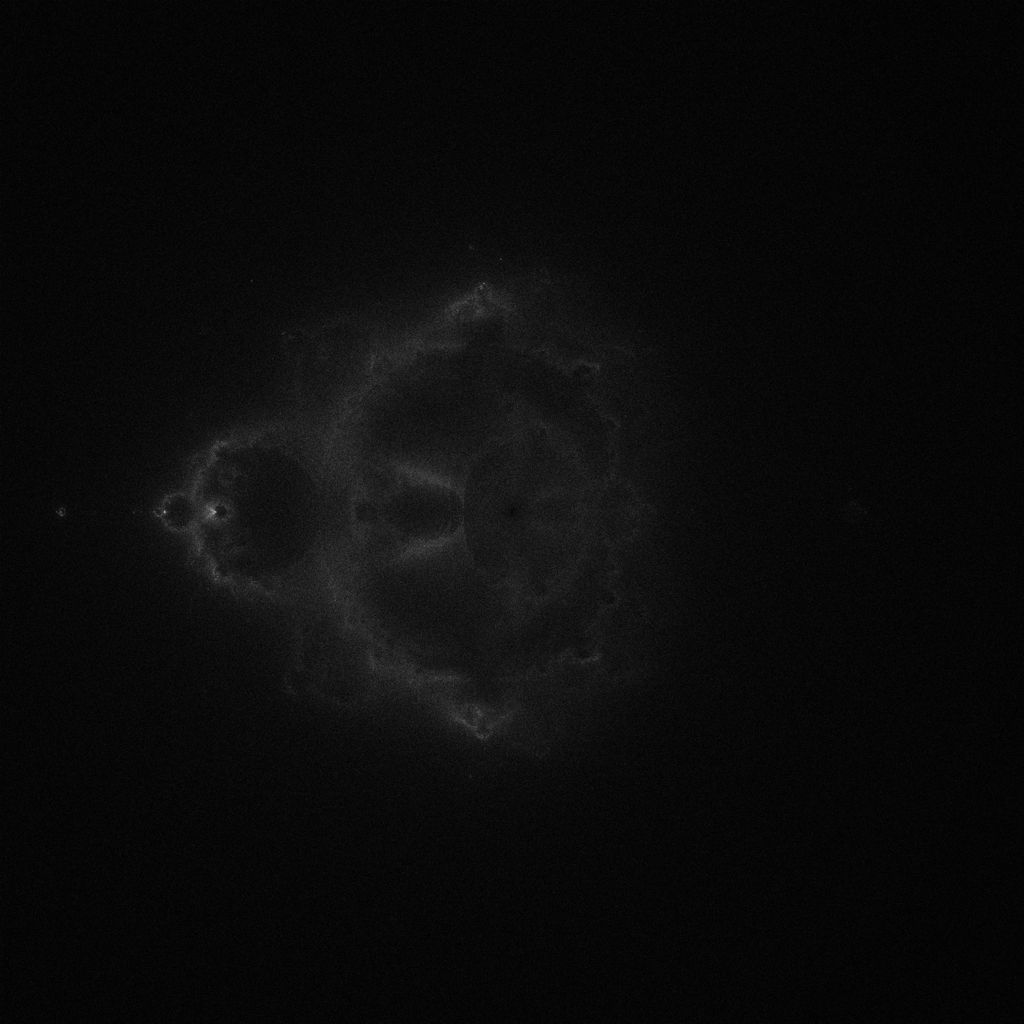
Looks good! Well, it looks good if you open it in another tab at least. The obvious next step is to increasing the number of iterations, in order to produce a cleaner render. Unfortunately, this leads to our first issue:

It's too dark! And if you zoom in on this image, you'll see that there are a few very bright pixels. These completely outshine all of the others. In order to resolve this issue, I'll be using histogtram shading, which is a fairly well-known technique for shading the Mandelbrot the way it is typically plotted. It is a straightforward technique for ensurring that each shade takes up approximately the same area of the screen as the other available shades. We do this by constructing a histogram and modifying the brightness of each point using that histogram. I'll also be turning the Buddhabrot on its side, which is how it is typically rendered, and zooming in on it more to get a better render. This also cuts out a lot of darker regions urther from the set, effectively reducing the "exposure" on our image and making the details pop out more.
By the way, here's a plot of the histogram of the top image on a log scale. Missing points correspond to histogram entries of 0, where the natural log is undefined.

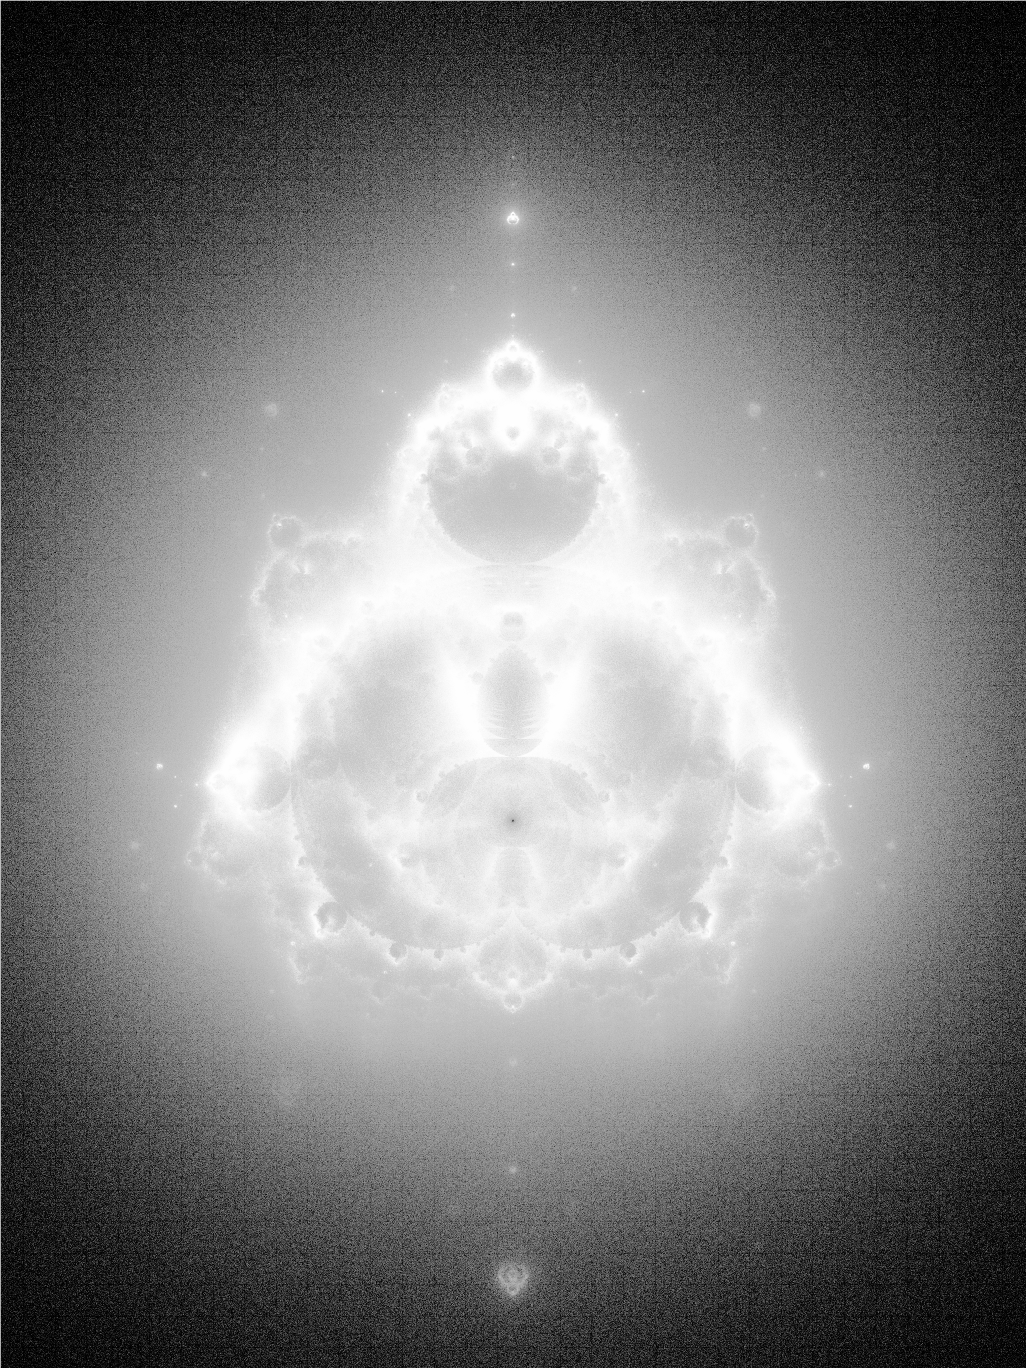
That's much better, although there are still a couple issues. The first is something you'll notice if you zoom in a bit, and its these gridlines of darker pixels. This is the result of using the default random-number generator for graphics purposes, which is typically not a good idea. A better idea would be to use a cryptographic number generator, and I found a pretty neat one called ISAAC. I messed around with it a bit to get it to compile in C++ without warnings and then plugged it in. I'll probably turn it into a proper C++ library at some point and throw it into my utility library. The below image represents 4 billion samples, whereas the previous image only had 400 million. I've also improved performance slightly by rejecting points immediately without simulating them if they fell within the main cardioid or period-two bulb.
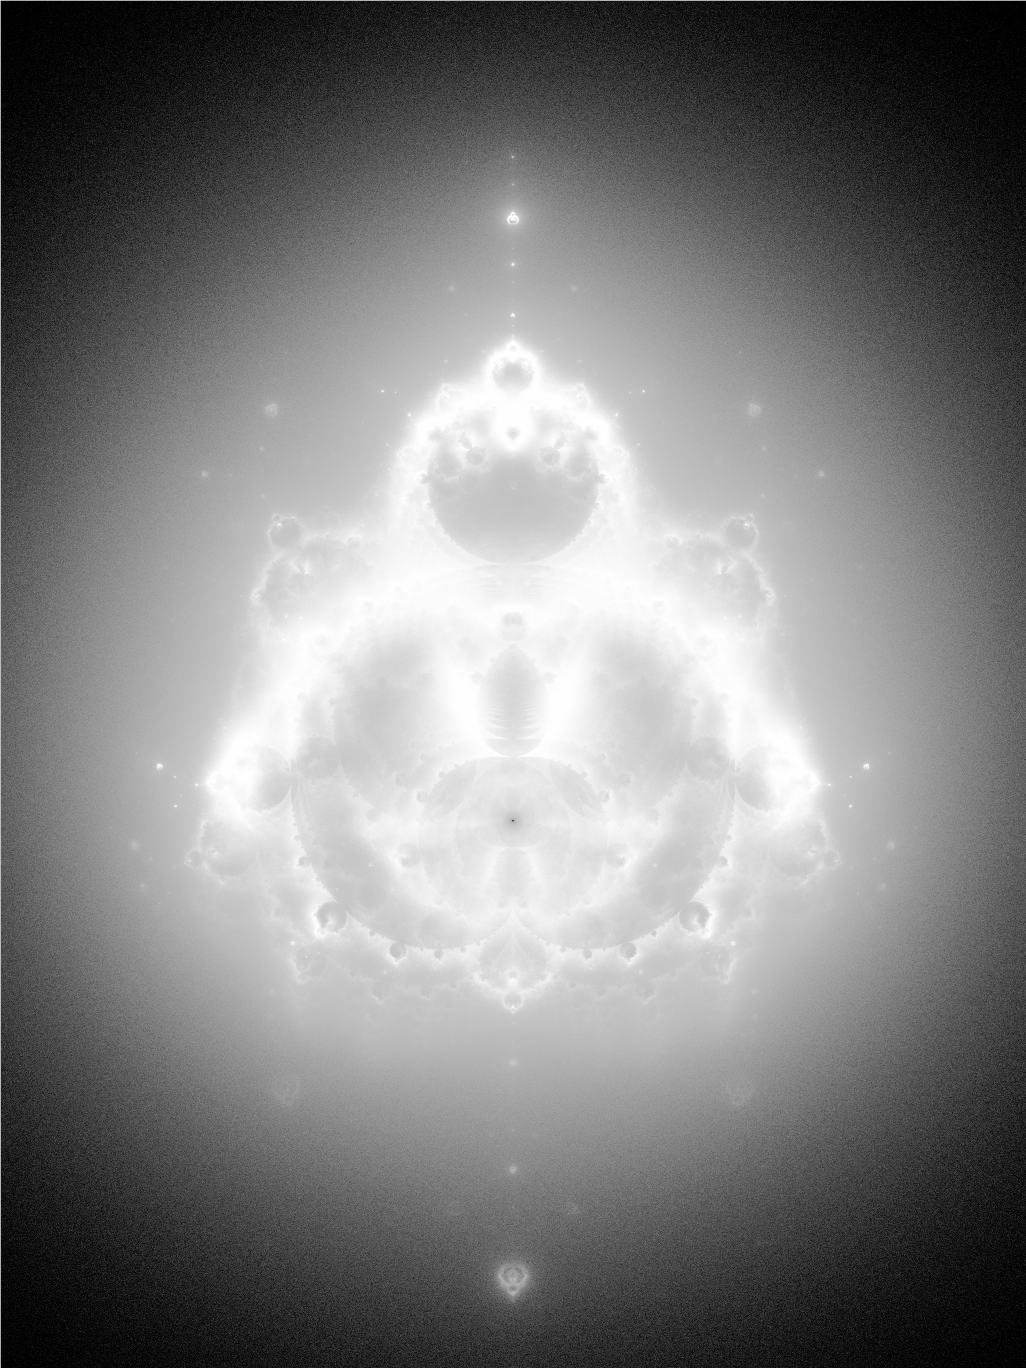
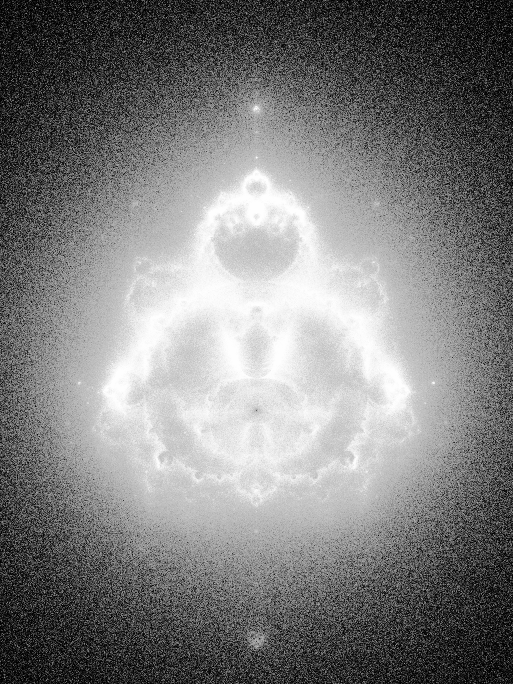
The second issue is the bright bars along the top and left of the image. When converting the real and imaginary components of a point to image coordinates, the final step in the process is converting from a float to an int, which always rounds toward zero. If a number is barely to the left of the image or barely above it, that point's position is rounded to zero and included instead of being excluded as it should be. As a result, all of these pixels are twice as bright as they should be. The solution to this is to add 0.5 to the coordinate before round, causing it to always be rounded to the closest integer. Here's a small test render without the issue.
Color
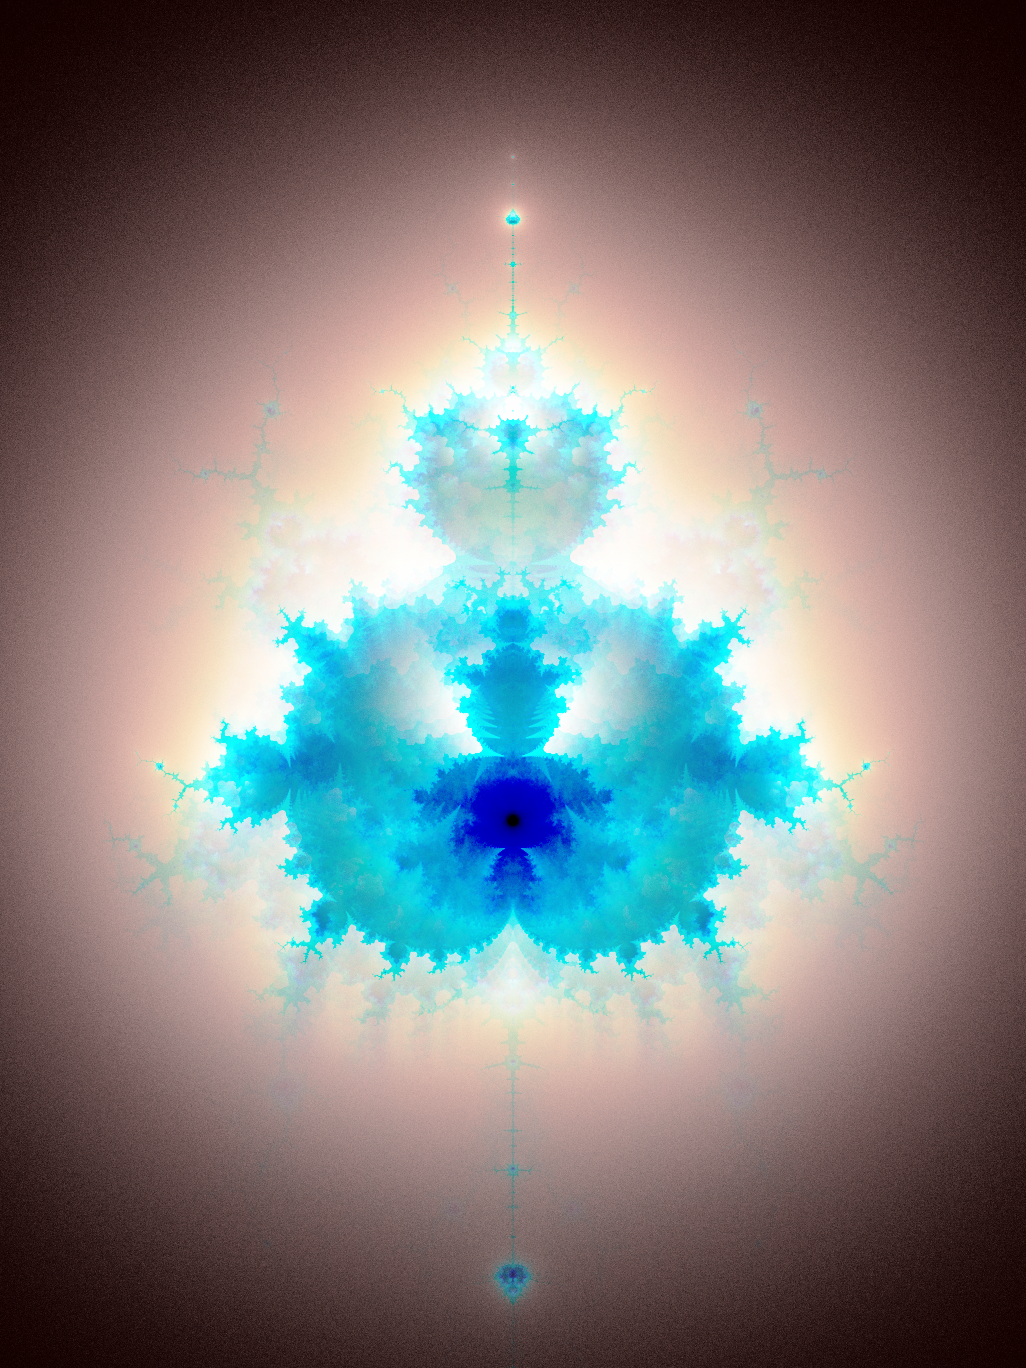
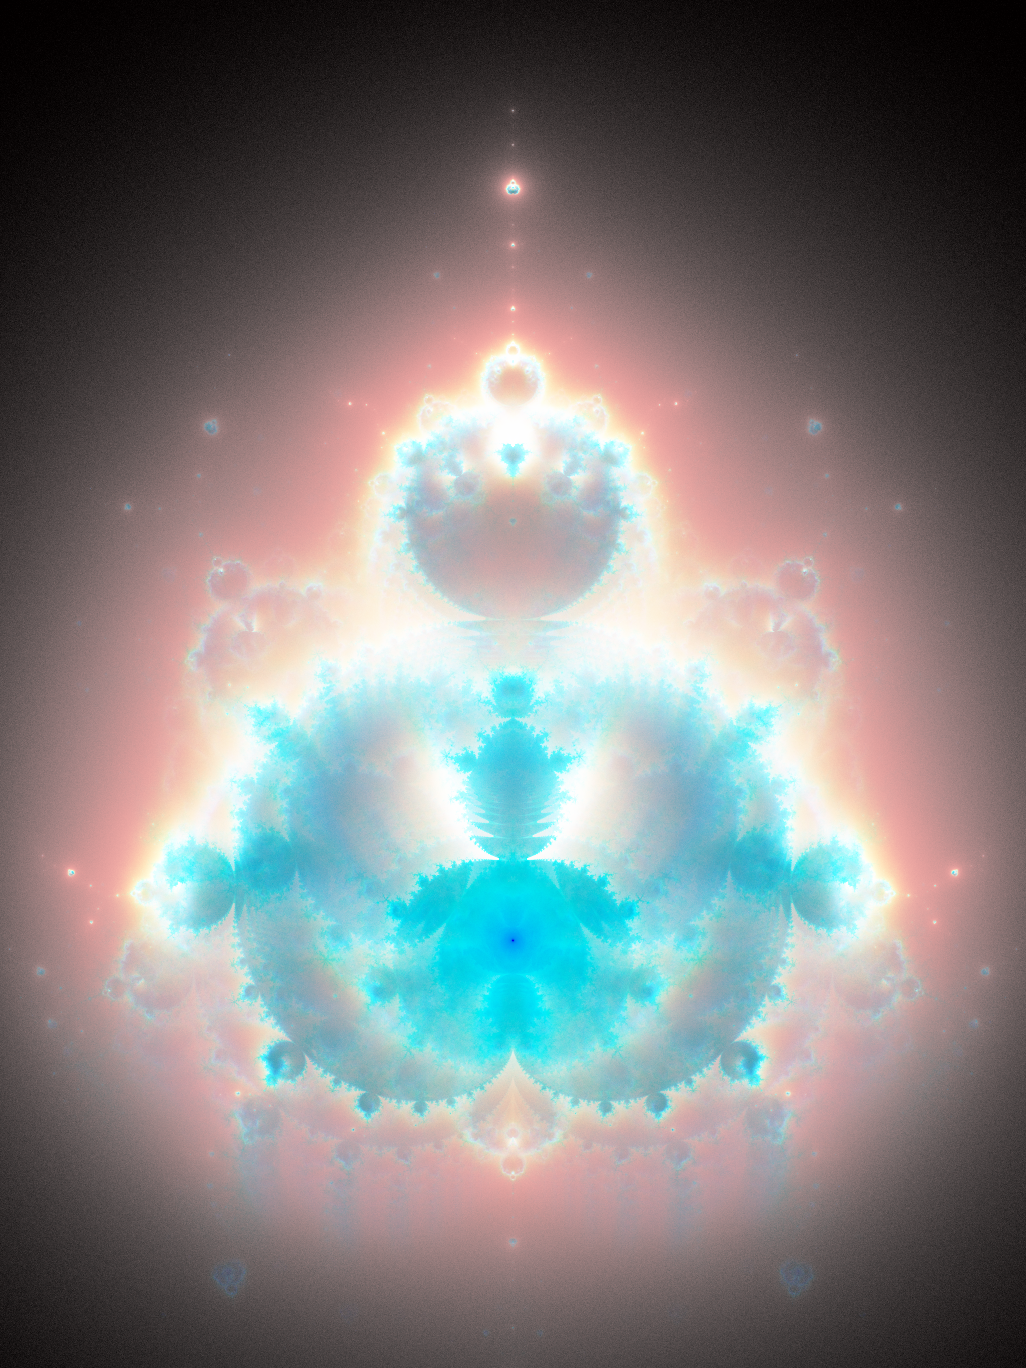
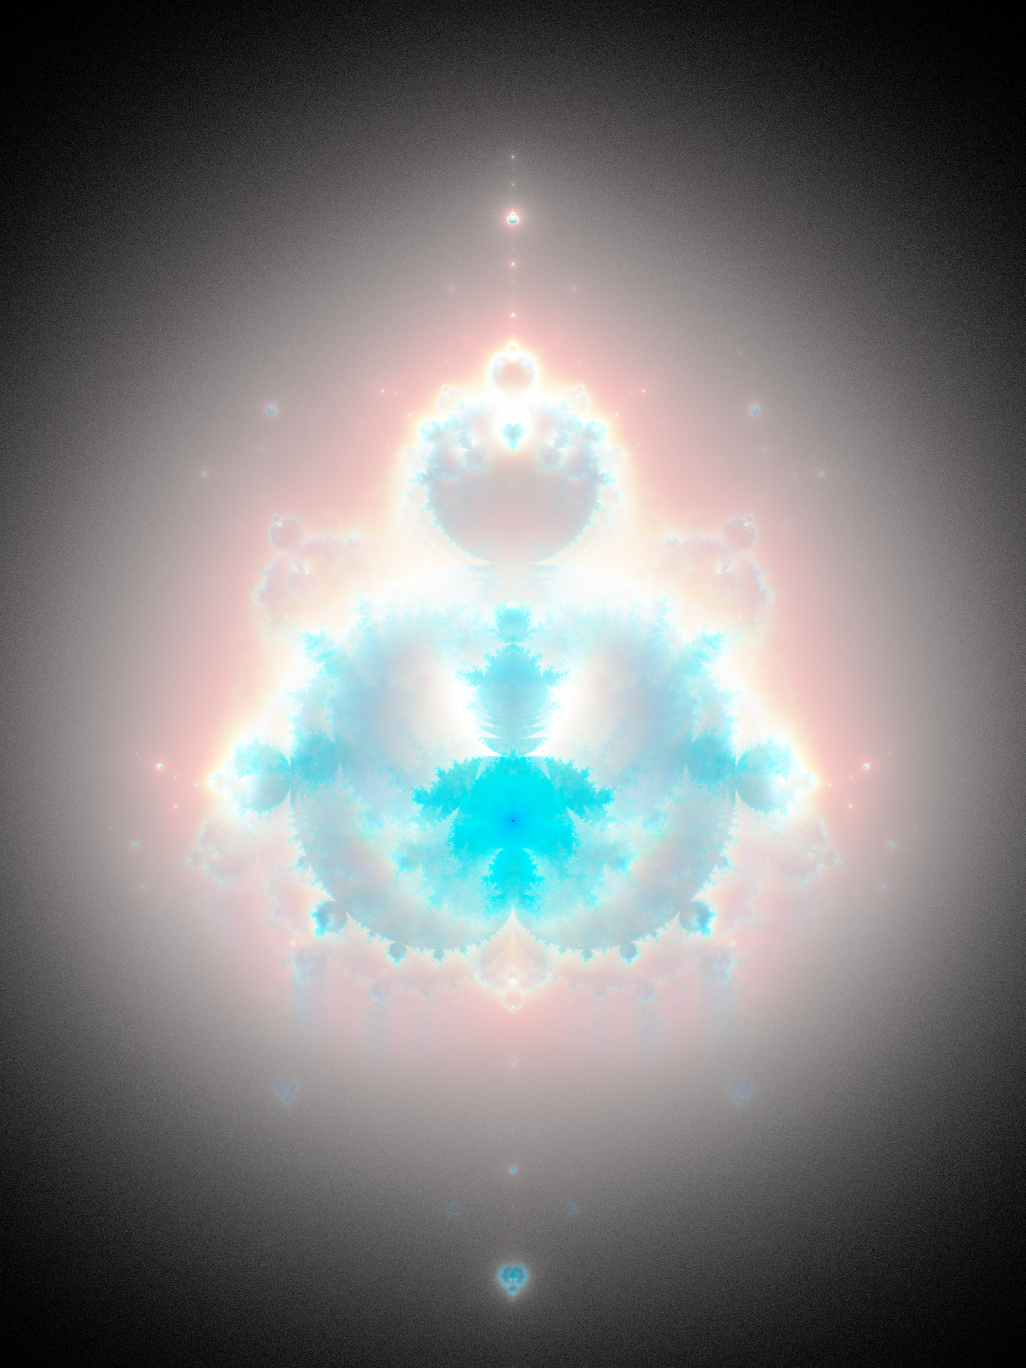
When you see images of the Buddhabrot on the internet, they'll typically be in full-color, but we only have one variable to use in coloring this thing. So, where do these colors come from? Well, the exact shape of the Buddhabrot depends on the maximum iteration count you chose. If a point exceeds this count without escaping, we ignore it. The trick, invented by Melinda Green, is to render multiple Buddhabrots in parallel and assign each image to the red, green, and blue channels of the final image. This is fairly straightforward and has little overhead because all of the calculations for a Buddhabrot render with a low max iteration can be re-used for a render with higher iterations. Below is a simple full-color render using 10 billion samples. We pull the same histogram trick on all of the channels separately.
There are two other renders I'd like to do before calling this project done. First, I'd like to make a render with very low max iter counts, and another one a bit more zoomed in. Maybe I'll try to come back and develop a faster, more sophisticated renderer at a later time. But for now, these are satisfying enough. Accelerating the Buddhabrot render is a painstaking task, and it is nigh impossible to parallelize because each thread needs to be able to increment values of random counters that are shared globally at any time, causing race conditions. There are a few ideas floating around the internet, like restricting each warp to only be able to write to a subset of the pixels.
